Analyzing Data

ALL DATA ANALYSIS RESOURCES

arithmetic mean
Locating an Arithmetic Mean

A tutorial on locating structured data, reviewing it in a text editor and then finding the arithmetic mean in Excel. Video 1 of 3.

calculating median
Calculating Median, Quartiles and Bounds

A tutorial on calculating the median, quartiles, upper and lower bounds on a data set in Excel. Video 2 of 3.

standard deviation
Calculating Standard Deviation and Z Score

A tutorial on calculating the standard deviation and z score on a data set. Video 3 of 3.

central tendency
Measures of Central Tendency

An introduction to measures of central tendency: mean, mode and median. Calculating these values will help you understand better your data: is it normally distributed or skewed? Which is the value that appears most frequently?

intro openrefine
Introduction to OpenRefine

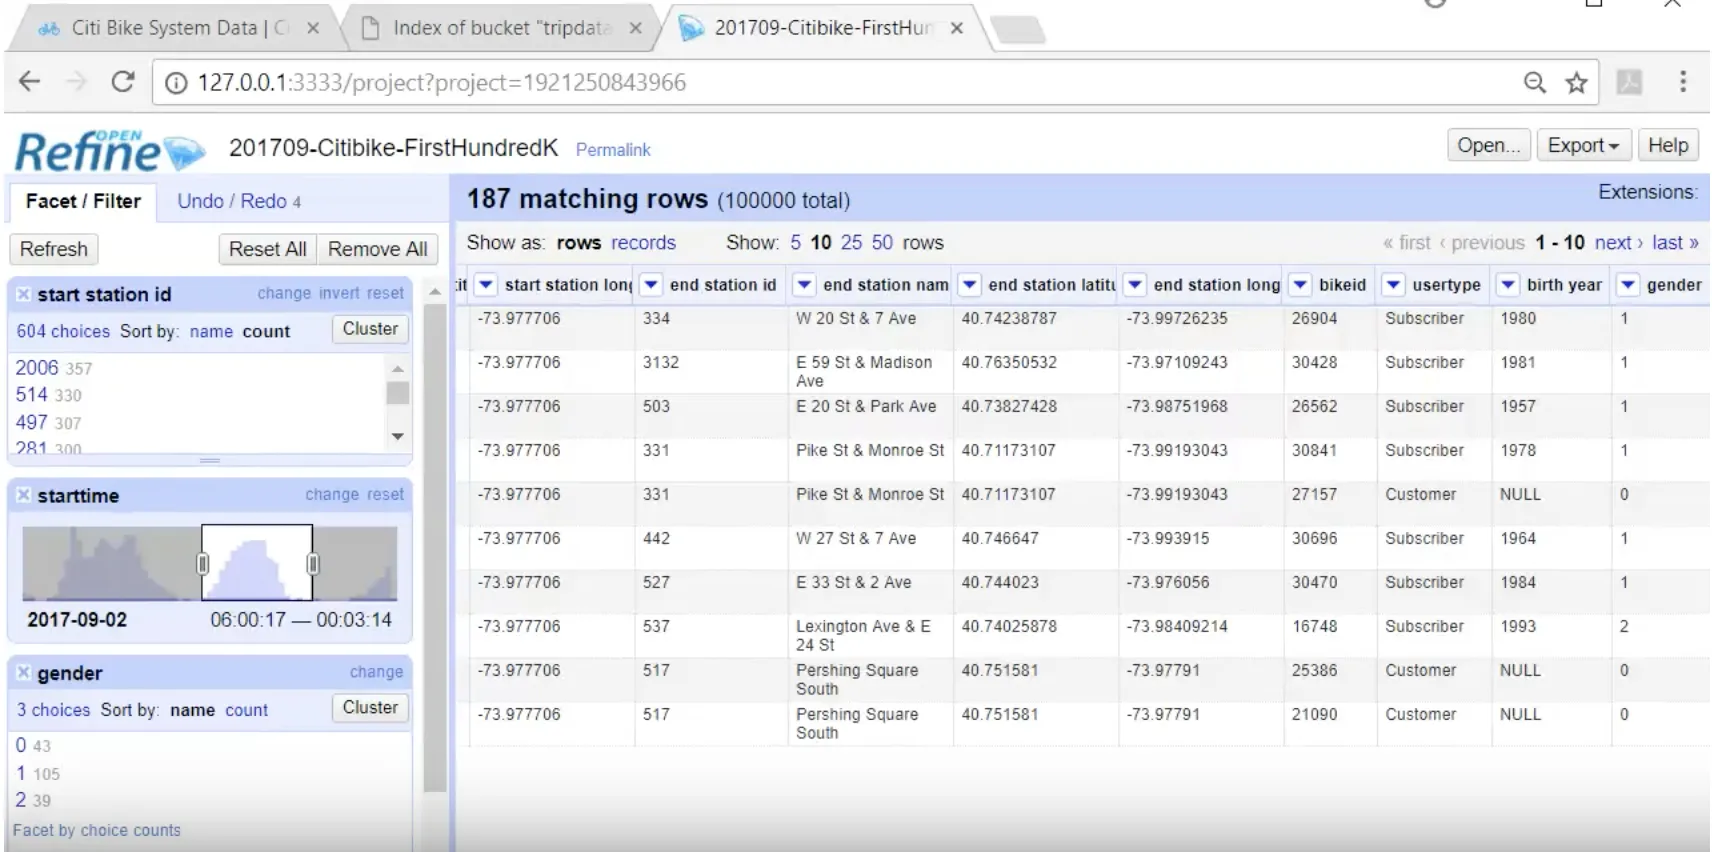
An introduction to OpenRefine, an open source tool for manipulating large, messy data sets. This tutorial explores facets and transformations to interview and analyze data. Video 1 of 3.

tow logo
Introduction to Regular Expressions

Slides with a brief introduction to Regular Expressions, how they work, some grammar and examples. RegEx are useful to search for and match a pattern in your data and clean it up from there.

regex on openrefine
Regex on OpenRefine

An introduction basic regular expressions in OpenRefine. Use these search patterns to edit your data in seconds. Video 2 of 3.

more openrefine cluster
More OpenRefine: Extract, Apply, Cluster

Learn how to edit data massively using the clustering feature. See how to apply/extract commands to step backwards and forwards through your work, as well as apply it to new or revised data sets. Video 3 of 3.

More OpenRefine and Regex

A tutorial with more tips for using OpenRefine to analyze, share and document data sets. And a bit more on regular expressions.

quantification
Quantification and Statistical Inference

An overview class on what to count, how to “interview the data,” statistical models, the uses of multi-variable regression in journalism, and correlation vs. causation.

Randomness and Significance

A class on causality, p-hacking, reproducibility, and triangulation

Visualization and Network Analysis

A class on visualization (built upon design principles from user experience considerations, graphic design, and the study of the human visual system) and social network analysis in journalism

merging tables tutorial
Merging two tables in OpenRefine

Read this tutorial to learn how to merge two data sets and analyze the results using OpenRefine. 

tow logo
The Curious Journalist's Guide to Data

A book about data journalism with few equations and no code that traces where data comes from, what journalists do with it, and where it goes after.

propublica logo
The ProPublica Guide to Bulletproofing Data

The ProPublica guide offers useful tips to make sure you're interviewing a data set comprehensively: create work logs, pull random samples, duplicate your work, show finding early, etc.

jupyter
First Python Notebook

A step-by-step guide to analyzing data with Python and the Jupyter Notebook: create filters, merge cells, add values, sort or group by specified conditions, all with pandas, an open-source library.

workbench logo
Workbench

A platform that allows journalists to scrape, clean, analyze and visualize data without requiring any coding

overview logo
Overview

A visualization and analysis tool designed for sets of documents, from dozens to millions of pages of material. Originally built for investigative journalists, it’s also used for legal work, training machine learning models, and research of all types.

openrefine logo
OpenRefine

A downloadable software that helps you sort and sift dirty data, cleaning it to the point where you can start your actual analysis

timelinejs logo
TimelineJS

An open-source tool that enables anyone to build visually rich, interactive timelines

pandas logo
Pandas

A high-performance data analysis tool for Python

nltk logo
NLTK

A Python library built to process large amounts of text. Whether you’re analyzing Congressional bills, Twitter outrages or Shakespearean plays, NLTK has you covered.

scikit-learn
scikit-learn

A Python package for machine learning and data analysis. It’s the Swiss Army knife of data science: it covers classification, regression, clustering, dimensionality reduction, and so much more.

I WANT TO

video-camera icon

Watch all the videos

book icon

Read all the materials

th icon

Explore all the available tools